
| SOCO Blog |
04 January 2016
BELATED CHRISTMAS GIFT
It's been a bit of a while since my last blog entry. So, what have I been doing with my time? Why, making you a gift! I had hoped to have it finished by Christmas, but it took me a bit longer than first planned. So, I can't offer it to you as a "Christmas Gift", but we'll have to settle with it being a belated Christmas gift.
If you follow my astro-imaging activities on this website, you know that one of my guiding principles is that I try to produce "true-color" renditions of imaged astronomical objects. That is, the objects in my imagery display the colors that they would actually have if your eyes were sensitive enough to adequately respond to the low light levels that these objects present. I go into this concept in some detail in the Image Processing page of this website. One of the things that has a major impact on the color balance in an astronomical image is atmospheric transmissivity. The amount and clarity of atmosphere between the object (outside the atmosphere) and the observer (at the bottom of the atmosphere) affects the degree to which the electromagnetic radiation (light) in the various wavelengths makes it to the observer (or camera). For example, light in the blue wavelengths is more strongly absorbed and scattered by the atmosphere than light in the red wavelengths. Thus, without atmospheric correction, an object would appear redder in an image acquired when the object was near the horizon than in an image acquired when the object was high in the sky, since the light had to pass through more atmosphere for the image acquired with the object near the horizon. Knowing the elevation angle of an object above the horizon, it is possible to correct the color balance of imagery to account for these atmospheric effects.
To perform these corrections, one must know the values of certain factors, called atmospheric extinction coefficients (k), that describe how the atmosphere attenuates light in the various wavelengths. I provide a detailed description of how to calculate the values of atmospheric extinction coefficients on this website. This procedure involves acquiring sets of images of stars in the red, green and blue spectral bands as the stars rise from near the horizon to positions high in the sky over the course of a night (or, alternately, fall from positions high in the sky to near the horizon). After the images have been acquired, they are subjected to a rather tedious series of analysis procedures to extract the values of the extinction coefficients. These procedures may take a number of hours to perform.
Well, who likes spending hours doing mathematical calculations? Probably not many people. So, the tedious nature of the manual calculations often reduces the frequency with which we might want to perform this task. So, what if we had something that would do all the calculations for us?
This brings us to the belated Christmas gift. Over the past few weeks I've written a computer application that does just that— it does all the calculations required for determining the values of atmospheric extinction coefficients for you! All you have to do ia acquire the imagery— when you copy the application into the folder containing the imagery and execute it, it does everything else. It even allows you to edit the results to remove the effects of outliers in the data. The result is a set of values for k for the red, green and blue spectral bands that you can use directly in processing astronomical imagery.
This application is called the SOCO Atmospheric Extinction Coefficient Calculator, or "SOCO-X". You can download the executable version of it from this website. In addition to the set of images, you'll need to give it a little additional information:
(1.) The latitude and longitude of the observing site.
(2.) The RA and Declination of the target star (the star in the images that you want to use for calculations).
(3.) The display size of your computer monitor, in columns and rows (lines).
The site latitude and longitude and the stellar RA and Declination are used in calculating the elevation angle of the target star for each image. The size of your computer display is used in scaling some of the graphical output of the application. For example, my current monitors are set at 1080 columns by 1920 lines. You can find this information in the "Display" characteristics page in most versions of Windows. Other information (like acquisition date and time) are taken automatically from the FITS file headers.
There are two requirements for the images that are to be analyzed by the application:
(1.) All the images must be co-registered so that the target star appears in the same place in each image.
(2.) The name of each image file must end in R, G or B, indicating whether it is a red, green or blue band image.
The first requirement comes from the fact that SOCO-X does not do any image registration. So, you have to co-register all the images before executing the application. The second requirement comes from the need for the application to know which spectral band (red, green or blue) each image has been acquired in, i.e., SOCO-X needs a way to separate the red, green and blue images so that the values of k can be calculated separately for each spectral band. There are a few ways that this could be done. The software that runs my imaging camera (Maxim DL) adds a line to the FITS header of each image that indicates the filter used during image acquisition. Unfortunately, this line is not required to satisfy the basic FITS Standard, so it might not be included in the headers of files produced by other software packages. However, most camera-operation software packages allow you to set up a "mask" for naming the image files as they are acquired. For example, in Maxim DL you assign letters that will be appended onto the end of the file name to indicate the type of file. So, the file "TARGETSTAR1_0001R.FIT" can easily be seen to have been acquired in the red spectral band, because the software added the "R" to the end of the file name. So, just set up your camera-control software to append an "R" to the red file names, a "G" to the green file names, and a "B" to the blue file names. Alternately, if your camera-control software can't do this, you can manually edit the file names to include the required letters after they're in your computer.
When you run SOCO-X within the folder containing the image files, the first thing it will do is display the first image on your monitor and ask you to indicate which star is the target star. You do this by putting the cursor on the star and left-clicking the mouse. Once that is done, this image disappears and the remaining images are processed. Processing is quite quick— it takes a little over 5 minutes to process 75 images on my desktop computer (around 4 seconds per image).
After all the images have been processed, SOCO-X will display a graph on your computer monitor in which the logarithm of target star magnitude (on the y-axis) is plotted versus the airmass (on the x-axis). An example is shown in Figure 1. Colored circles on the graph show the data points derived from each image. The colored lines in the graph show the regressions through the data points for each spectral band— the slopes of these regression lines represent the values of the extinction coefficients. The values of the coefficients are presented in the application dialog window (not shown).
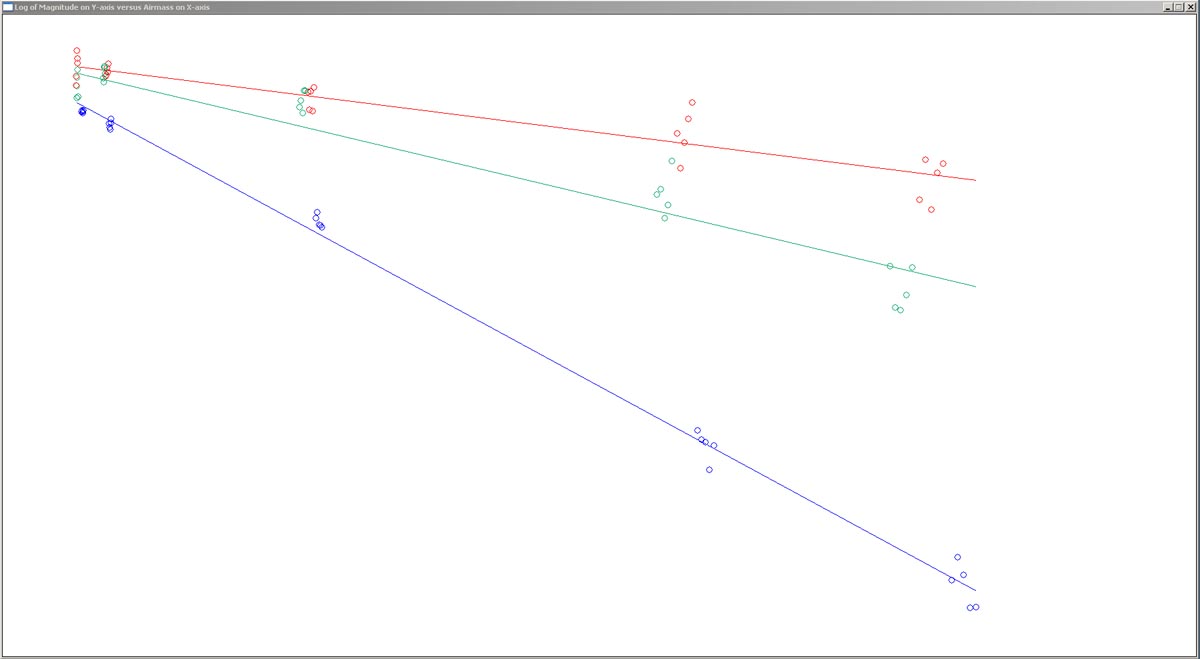
Figure 1. SOCO-X graph showing the data for individual images (colored circles) and the linear regressions through them (colored lines).
I have not provided any labels on the axes of the graph (I might do this in a future version of the application). These are not really important, because the main purpose of the graph is to identify outlier points in the data set. So, what is important in the graph is how the points for a given spectral band cluster along their respective regression line. One would normally expect a certain amount of scatter among the points along the regression line due to random errors in the data (like what we see in Figure 1). However, it is possible to have situations where some points fall markedly below the regression line, i.e., there is obviously something wrong with these points. For example, some high thin clouds may drift across the part of the sky where the target star is— these clouds are difficult to detect visually but can decrease the magnitude of the star when it is imaged. This will cause the affected points to fall below the regression line. Another example is the situation where the image of the target star is saturated. This may occur when the star is highest in the sky and therefor experiences the least amount of attenuation. That is why it is important in acquiring the imagery to use an exposure time (usually just a few seconds) that is short enough to preclude saturation of the star image when it is at its brightest (high in the sky).
The usual solution for data outliers is to remove them from the data set and re-calculate the regressions. SOCO-X will allow you to interactively use the graph to remove outliers one point at a time. To remove a point, just put the cursor on it in the graph and left-click the mouse. The point in the graph will change to a yellow circle and the application will ask you if this is the point that you want to remove. If you indicate that it is the correct point, SOCO-X will remove it from the graph (and the data set) and re-calculate the regressions based on the revised data set. You can keep doing this until you are satisfied that all the outliers have been removed. At this point, you can write down the values of the extinction coefficients and terminate the program.
One other thing that SOCO-X produces is a file called "SOCOX-LOG.TXT". This is an ASCII text file that documents what the application did during the time it was running. The primary use for this file is as a diagnostic tool in case the SOCO-X program fails. If you try using the application and it doesn't work, send me an email (SOCO@cat-star.org) and attach the text file so I can figure out what the problem is and correct it.
Using SOCO-X, I was able to quickly process my backlog of stellar imagery to update the extinction coefficient climatology presented elsewhere on this website. Since this application is so easy to use, I can now go back and analyze more stars in my archive of imagery to come up with even better estimates of the extinction coefficients. Hopefully this application will be of similar use to some of you in your astro-imaging activities.
 Return to SOCO Blog Page
Return to SOCO Main Page
Return to SOCO Blog Page
Return to SOCO Main Page
Questions or comments? Email SOCO@cat-star.org